THE PRECIPITATION HISTORY DISPLAY

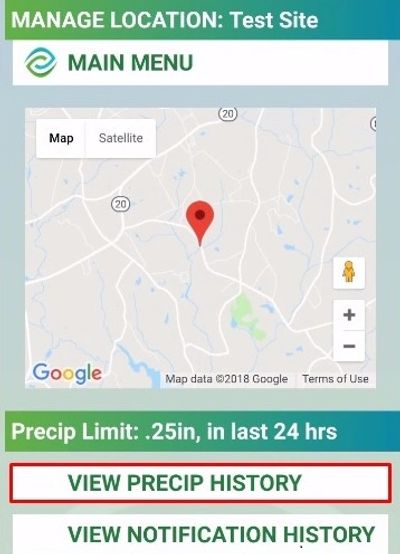
When you set a location for WaterWatch PRO to monitor, you can see the precipitation history of the last 48 hours right from the app.
It is important to understand that the app displays both the hourly rainfall and the 24-hour accumulated total ending at each hour. As rain falls, the hourly values will change, but occasionally, the 24-hour value can either increase, decrease or remain the same. Why is that?
Basically, as rain accumulates in an hour, the 24-hour total loses the hourly value from 24 hours ago. The displayed value in the 24-hour total is always the sum of the last 24 hours.
So, one way to think about the 24-hour value is like your bank account. Checking the balance after making a deposit usually makes the balance go up. However, the next day, it can drop when a check is cashed, or an ATM withdrawal is debited.
Here is a real example:
Time Last 24hr Last Hour
2018-07-01 23:30 0.46in 0.04in
2018-07-01 22:30 0.47in 0.00in
2018-07-01 21:30 0.55in 0.00in
2018-07-01 20:30 0.63in 0.08in
2018-07-01 19:30 0.62in 0.11in
2018-07-01 18:30 0.53in 0.27in
2018-07-01 17:30 1.02in 0.00in
2018-07-01 16:30 2.29in 0.00in
2018-07-01 15:30 2.29in 0.00in
2018-07-01 14:30 2.29in 0.00in
2018-07-01 13:30 2.29in 0.00in
2018-07-01 12:30 2.29in 0.00in
2018-07-01 11:30 2.29in 0.00in
2018-07-01 10:30 2.29in 0.00in
2018-07-01 09:30 2.29in 0.00in
2018-07-01 08:30 2.29in 0.00in
2018-07-01 07:30 2.29in 0.00in
2018-07-01 06:30 2.29in 0.00in
2018-07-01 05:30 2.29in 0.00in
2018-07-01 04:30 2.29in 0.00in
2018-07-01 03:30 2.29in 0.00in
2018-07-01 02:30 2.29in 0.00in
2018-07-01 01:30 2.29in 0.00in
2018-07-01 00:30 2.29in 0.00in
2018-06-30 23:30 2.29in 0.01in
2018-06-30 22:30 2.29in 0.08in
2018-06-30 21:30 2.20in 0.08in
2018-06-30 20:30 2.12in 0.07in
2018-06-30 19:30 2.05in 0.02in
2018-06-30 18:30 2.03in 0.76in
2018-06-30 17:30 1.27in 1.27in
2018-06-30 16:30 0.00in 0.00in
Rain begins falling after 16:30 on June 30 and 1.27” accumulates within the next hour. It keeps raining through 23:30 on June 30, then stops. The 24-hour accumulated value is 2.29”.
Then, on 17:30 the next day, July 1, the 24-hour value drops to 1.02” because the running total loses the 1.27” value from 17:30 the day before and is now 1.02”. Then, it starts raining again and .27” falls, but the 24-hour value falls again to .53” This is due to the loss of .76” from 18:30 the day before. It rains for the next two hours and the new 24-hour total rises to .63” by 20:30 on July 1.
Notice that the 24-hour total falls again the next hour to .55 due to the loss from the total of .08 from the day before.
WaterWatch PRO sends a text and/or email notification when the 24-hour total meets or exceeds a threshold you set. In this case, the threshold was set to .5”, so the user was notified at 17:30 on June 30 and again at 19:30 on July 1.
WaterWatch PRO is a product of Wise Weather, LLC Copyright © 2025
This website uses cookies.
We use cookies to analyze website traffic and optimize your website experience. By accepting our use of cookies, your data will be aggregated with all other user data.